Court Opinion Analytics provide interactive analysis capabilities for understanding the underlying patterns of your data.
Currently, Juritool™ provides you the possibility of analysing the centrality of an opinion and finding "good law", and providing the possibility of risk analysis of your case and also getting stats of your data.
Clicking on portions of the diagrams leads you to your target data. This is something unique to Juritool™, and it can ease your search for information.
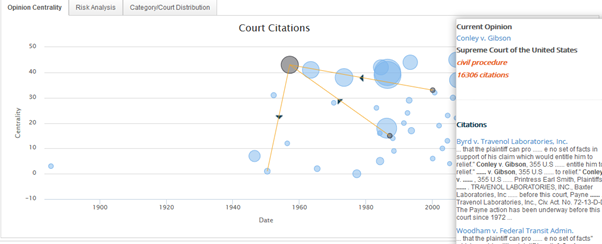
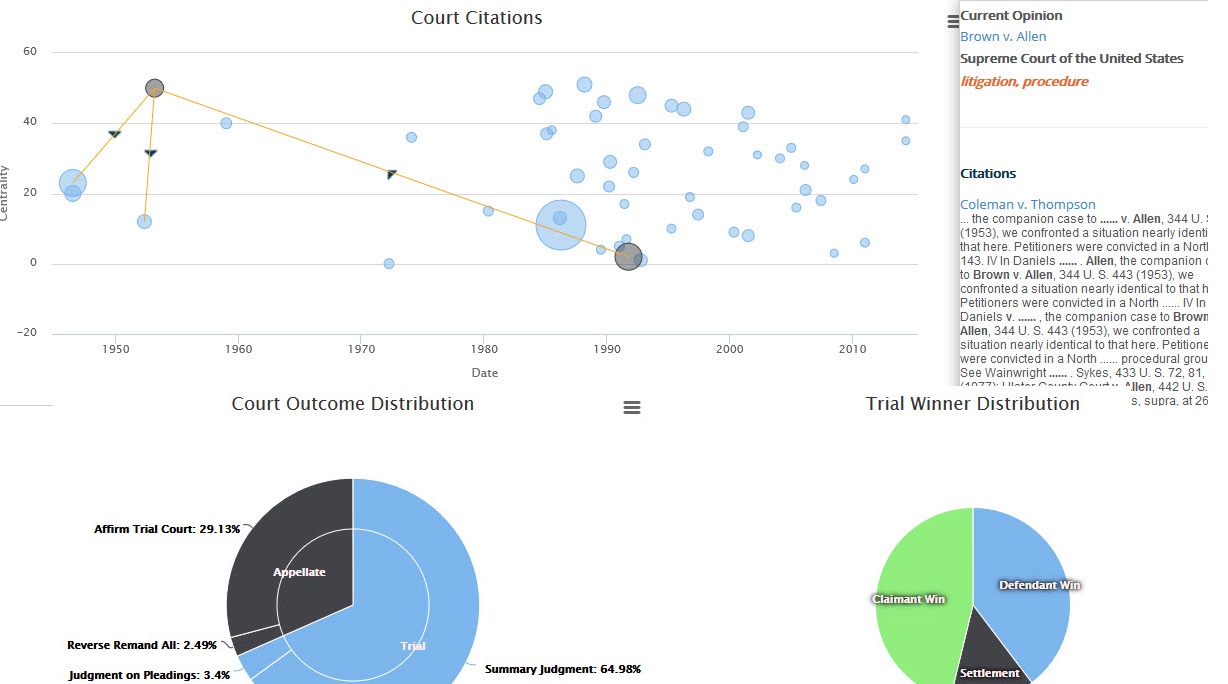
Opinion Centrality shows the relations between the most important opinions of your results.
While you can visualize incoming and outgoing citations of a given opinion, the right panel shows how the incoming links (citations) are discussed in the referenced opinion.
This enables you to understand whether the case finding is good or bad. For a lawyer it is very important to immediately see whether an opinion is overruled or not. Law can change overnight without your notice; it is crucial to use Juritool™ which provides you these overviews.
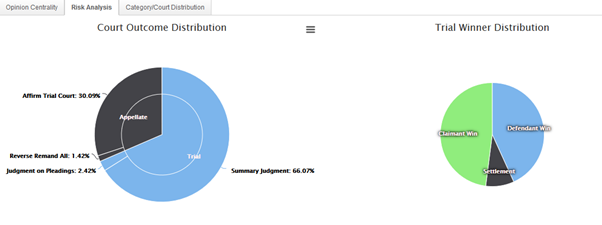
In the risk analysis graph, you can see the outcome probability of a similar case of yours. While the outcomes are only a suggestion of how your case may end, history shows that like cases follow the same paths.
Select the filters which are relevant to your case and hence you will see outcome probability of winning it. This saves attorneys and clients time when looking ahead at their next case moves. Measure the outcome of your case and always makes the optimal move with Juritool™.
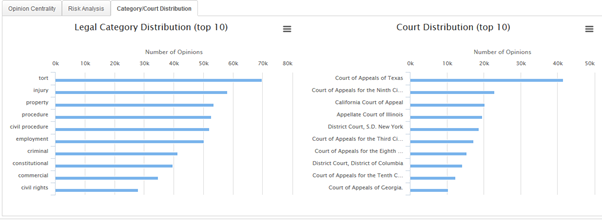
In the category/court analytics, Juritool™ provides an overview of the top 10 items. You can hence understand the major categories and court distribution and you can click on items to filter your results.